

Looking to maximize your ad spend? Here’s what you need to know about Target ROAS benchmarks for e-commerce:
- Target ROAS (Return on Ad Spend) is a key metric that helps you measure the revenue earned for every dollar spent on ads. It’s calculated by dividing revenue by ad spend.
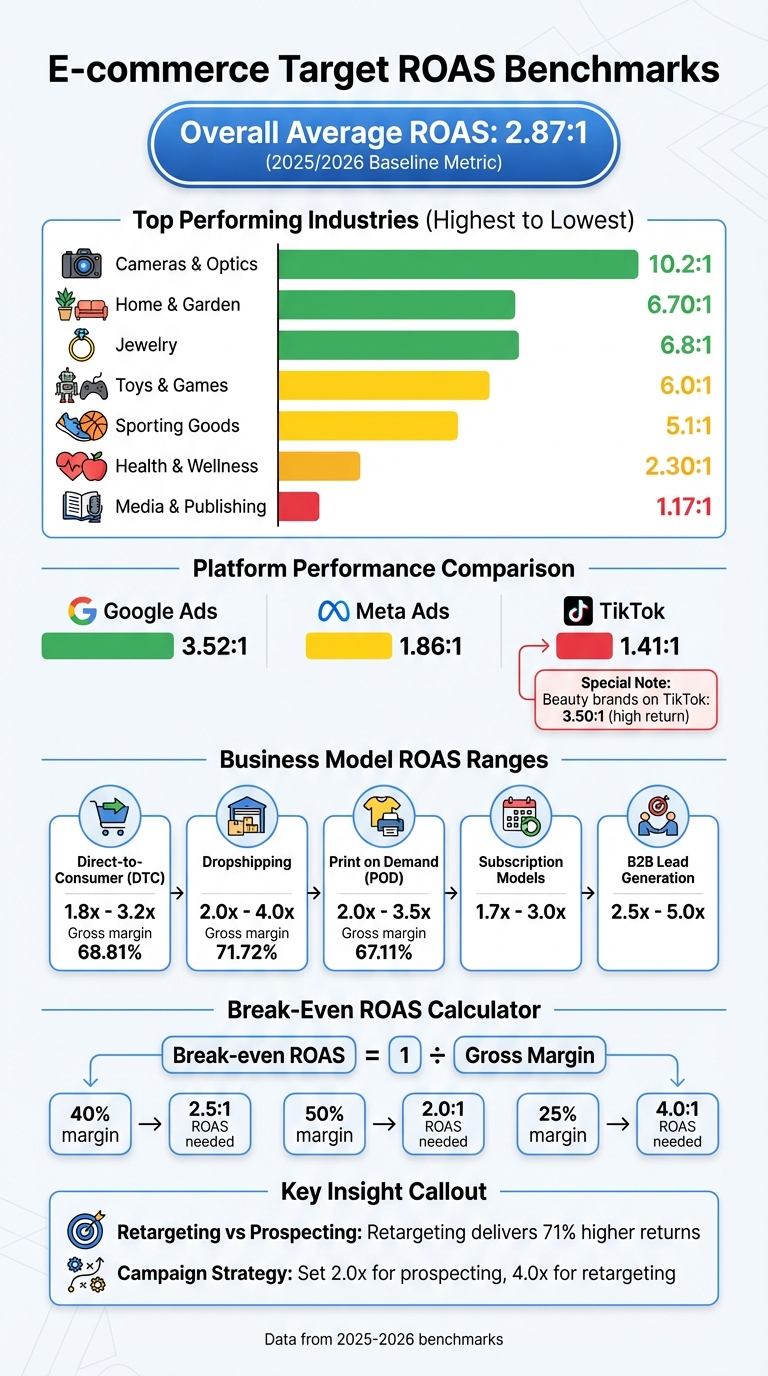
- The average ROAS across e-commerce industries is 2.87:1 for 2025/2026, but the "ideal" ROAS depends on your profit margins and business model. For instance, businesses with thin margins often need a ROAS above 3:1 just to break even.
- Industry-specific ROAS ranges vary widely. Luxury categories like Cameras & Optics average 10.2:1, while saturated markets like Media & Publishing may see as low as 1.17:1.
- Platform performance differs: Google Ads averages 3.52:1, Meta Ads 1.86:1, and TikTok 1.41:1. However, niches like beauty brands perform better on TikTok with a 3.50:1 ROAS.
- Business models impact ROAS goals: Direct-to-Consumer brands aim for 1.8x–3.2x, while dropshipping businesses often need 2.0x–4.0x due to higher costs.
Takeaway: Start by calculating your break-even ROAS based on your gross margin. Then, set platform-specific goals and adjust based on industry trends and your business model. Retargeting campaigns often deliver better results (71% higher returns) than prospecting, so allocate your budget wisely.
E-commerce ROAS Benchmarks by Industry and Platform 2025-2026
What’s the right ROAS target for Google Ads?
sbb-itb-8b1a57a
1. Industry-Specific Benchmarks
The average ROAS (Return on Ad Spend) sits at 2.87:1, but this number can swing dramatically depending on the industry - ranging from over 6:1 in some sectors to below 2:1 in others.
Profit Margins
To determine your break-even ROAS, divide 1 by your gross margin. For instance, a 40% margin requires a 2.5:1 ROAS to break even, while a 25% margin needs a 4:1. Industries with higher margins, like luxury jewelry, can sustain profitability with lower ROAS targets. On the other hand, low-margin sectors such as electronics or dropshipping often need ROAS well above 3:1 just to cover their operational costs.
ROAS Ranges
Industry benchmarks highlight significant performance disparities. For example, in March 2026, Cameras & Optics led the pack with an impressive average ROAS of 10.2:1, while more saturated markets struggled, with some sectors bottoming out at just 1.8:1. In 2025, Home & Garden brands achieved a solid average ROAS of 6.70:1, benefiting from high order values and repeat customers. Similarly, Toys & Games performed strongly, averaging 6.0:1
At the other end of the spectrum, Media & Publishing faced challenges, with Meta Ads delivering a ROAS as low as 1.17:1, while Health & Wellness saw an average of just 2.30:1. Platform-specific results also vary: Google Ads averages 3.52:1, Meta Ads 1.86:1, and TikTok lags behind at 1.41:1. However, certain niches break the mold; for example, Beauty brands on TikTok can achieve a strong 3.50:1, proving that well-executed campaigns tailored to the platform’s audience can defy averages.
Growth Potential
Emerging industries like Food & Beverage and Pets & Animals showed over 7% ROAS growth year-over-year in 2025, while more mature or regulated sectors like Health & Wellness saw declines. The Automotive category on Meta showed modest growth, with a 1.66% year-over-year improvement, reaching a ROAS of 2.54:1 in 2025. Meanwhile, categories like Jewelry (rising from 4.0:1 to 6.8:1) and Sporting Goods (averaging 5.1:1) demonstrate strong potential for scaling due to their favorable economics.
These benchmarks and trends provide a clearer picture of how different industries and business models shape target ROAS expectations.
2. Business Model Benchmarks
Understanding business model-specific ROAS (Return on Ad Spend) is crucial for fine-tuning campaigns and scaling ad spend effectively. Your business model not only dictates your break-even ROAS but also influences how aggressively you can invest in advertising. For example, Direct-to-Consumer (DTC) brands, with an average gross margin of 68.81% and a net margin of 33.51% as of March 2026, typically aim for a ROAS between 1.8x and 3.2x. On the other hand, dropshipping businesses, which average a 71.72% gross margin, require a higher ROAS - ranging from 2.0x to 4.0x - due to elevated fulfillment costs. Let’s break down how profit margins shape these ROAS targets across different business models.
Profit Margins
Calculating your break-even ROAS is straightforward: divide 1 by your gross margin. For instance, a business with a 40% gross margin needs a minimum ROAS of 2.5x to cover costs, while a 50% margin lowers the requirement to 2.0x. Businesses operating with gross margins below 50% face higher risks; even small increases in advertising or shipping costs can eat into their profits. Consider Print On Demand (POD) businesses: while they average a 67.11% gross margin, their net margins are just 22.35%. To stay profitable, POD models generally need a ROAS between 2.0x and 3.5x.
ROAS Ranges
ROAS requirements vary widely across industries and business types. As rule1.ai explains:
"A 2.0x ROAS is profitable at 60% margins and a disaster at 25% margins." – rule1.ai
Subscription-based models often accept lower initial ROAS (1.7x to 3.0x) because they emphasize long-term customer lifetime value. In contrast, B2B lead generation campaigns typically target higher returns, ranging from 2.5x to 5.0x, with top-performing campaigns reaching 6.0x or even 10x. Manufacturing businesses averaged a ROAS of 5.36x in 2025–2026, driven by high-value contracts and niche markets, while retail e-commerce struggled with lower averages, around 1.73x, due to rising cost-per-click (CPC) rates squeezing margins.
Growth Potential
If you’re looking to scale, you’ll need additional margin to support increased ad spend. A good rule of thumb is to expand your budget only when your current ROAS exceeds the break-even point by at least 20%. For growing DTC brands, operating at a 1.5x ROAS can help build market share, provided their LTV-to-CAC (Lifetime Value to Customer Acquisition Cost) ratio is strong. As brands scale, they often allocate more budget to discovery platforms. For instance, Meta’s ROAS can jump by 50% during high-demand periods like Black Friday or Cyber Monday. Additionally, retargeting campaigns generally outperform prospecting, delivering 71% higher returns. Setting different ROAS targets for each funnel stage - such as 2.0x for prospecting and 4.0x for retargeting - can ensure steady growth at the top of the funnel.
Pros and Cons
When deciding between industry-specific benchmarks and business model benchmarks, it's essential to balance both approaches carefully. Each offers unique insights that can guide your strategy.
Industry benchmarks provide external performance metrics, helping you identify whether a sudden dip in performance is due to internal factors, like creative issues, or broader trends, such as seasonal shifts. They're especially useful for assessing platform fit. For example, Beauty brands often see a 3.50× ROAS on TikTok, compared to just 1.57× on Meta.
On the other hand, business model benchmarks focus on internal profitability. They act as a financial compass, factoring in your specific margins, cost of goods sold (COGS), and fees - elements industry averages don't consider. For instance, while a 2.0× ROAS might seem solid when compared to industry standards, it may actually fall short if your gross margin is 40%, as your breakeven ROAS would be 2.5×. This means you're not covering costs, even if the numbers look decent on paper.
The table below outlines the differences between these two approaches:
| Feature | Industry-Specific Benchmarks | Business Model Benchmarks |
|---|---|---|
| Flexibility | Low; based on broad category averages | High; tailored to specific margins, COGS, and fees |
| Scalability | Identifies which platforms offer the most potential for growth in a vertical | Pinpoints the exact point where spending turns unprofitable |
| Applicability | Ideal for new brands or those exploring new categories | Best for established brands with consistent data |
| Primary Risk | Risk of scaling unprofitably | Requires detailed internal data tracking |
This comparison underscores the importance of blending these approaches. Relying solely on industry benchmarks risks overlooking critical unit economics.
To avoid scaling at a loss, it's crucial to evaluate your breakeven ROAS. Industry benchmarks can help you understand your market position and whether you're within the typical range (usually within 20% of the industry average). Then, business model benchmarks can refine your strategy by setting precise spending limits and growth targets.
Conclusion
Start by aligning your Target ROAS with your breakeven point to make sure every dollar spent on advertising contributes to profit. This is an internal metric you calculate by dividing 1 by your gross margin - it reflects your specific cost structure and is far more relevant than any generic industry average.
Once you’ve set your baseline, use benchmarks as flexible reference points. For example, the 2.87× average in e-commerce gives you a sense of where the market stands, but it doesn’t factor in your unique margins, customer lifetime value, or growth stage. Avoid applying the same target across all platforms, as performance varies significantly depending on the channel and user intent.
Refine your strategy by segmenting campaigns based on objectives and where they fall in the funnel. Benchmarks suggest setting lower ROAS targets for prospecting and awareness campaigns that focus on audience-building, and higher targets for retargeting and branded search campaigns, where intent to purchase is stronger. Retargeting campaigns, for instance, tend to deliver about 71% higher returns than prospecting. Monitor performance over 90-day rolling periods instead of reacting to weekly changes, and adjust for seasonality - expect around a 50% boost during Q4, followed by a dip in Q1.
For Shopify merchants navigating rising CPMs and shifting platform algorithms, professional PPC management can help translate benchmark data into strategies tailored to your specific cost structure. Martin Monroe Creative specializes in PPC advertising for Shopify stores, offering expertise in platform-specific strategies, high-volume creative testing to combat fatigue, and recovering attribution accuracy impacted by iOS privacy updates. With Meta CPMs up 19.2% and Google CPCs rising 12.88% year-over-year, expert guidance ensures you’re scaling effectively rather than simply spending more to maintain results.
FAQs
What ROAS should I target for my store?
A reasonable target ROAS for your store usually ranges between 2.8:1 and 4.5:1. The ideal figure depends on factors like your industry, profit margins, and the platform you're using. For reference, the industry average is expected to be around 2.87:1 in 2026. These benchmarks can help you set achievable goals and measure your performance accurately.
How do I calculate my break-even ROAS?
To figure out your break-even ROAS (Return on Ad Spend), use this simple formula: divide 1 by your profit margin percentage. For instance, if your profit margin is 25%, the calculation would look like this: 1 ÷ 0.25 = 4:1. This means you need to earn $4 in revenue for every $1 spent on ads just to cover your costs.
To determine your profit margin, subtract all expenses (like product costs, shipping, fees, etc.) from your total revenue. Then, divide the remaining profit by your total revenue.
Why does ROAS vary so much by platform?
ROAS (Return on Ad Spend) can differ significantly depending on the platform, and this largely boils down to variations in user intent, audience behavior, and the nature of the ad environment. For instance, Google Shopping often delivers a higher ROAS because its users are typically further along in the buying journey, actively searching for products to purchase. On the other hand, platforms like TikTok generally show lower ROAS since the primary focus there is entertainment, not shopping.
Beyond user intent, factors like ad formats, targeting capabilities, and industry-specific nuances also play a big role in shaping these differences. Each platform has its own strengths and challenges, which can influence how effectively ads convert.